Here’s an overview of the most-important metrics for measuring success in this field. Take a look and see which to emphasize in your organization.
Each month, MetricNet highlights a Key Performance Indicator for Service and Support. We define the KPI, provide recent benchmarking data for the metric, and discuss key correlations, and cause-and-effect relationships for the metric. The purpose of the column is to familiarize you with the Key Performance Indicators that really matter to your organization, and to provide you with actionable insight on how to leverage these KPIs to improve your performance!
This month, I depart from our usual format and discuss not one metric, but eight separate IT service and support metrics. The idea here is to give you an overview of the metrics landscape, and to share with you the eight Key Performance Indicators (KPIs) that really matter!
The vast majority of IT support organizations are tracking too many metrics – oftentimes 20 or more! Unfortunately, this approach favors quantity over quality, resulting in wasted time and energy on a metrics bureaucracy that provides little insight and few tangible benefits. A list of the most common service desk metrics is shown below.
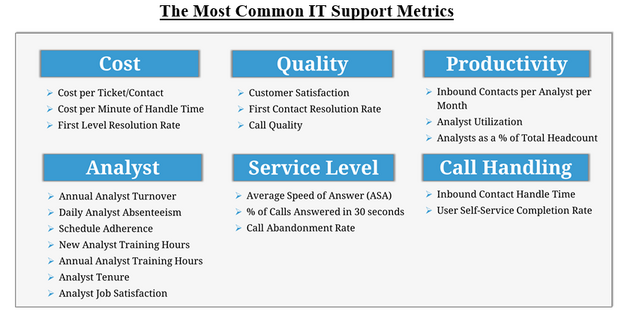
Reporting on all of these metrics weekly or monthly is a lot of work and produces only marginal benefits. The eight KPIs that yield the best value and deserve your time and attention are the following:
- Cost per Ticket
- Customer Satisfaction
- First Contact Resolution
- Analyst Utilization
- First Level Resolution
- Mean Time to Resolve
- Analyst Job Satisfaction
- Balanced Score
These metrics represent the 80/20 rule for IT Support KPIs: 80% of the value you receive from performance measurement and management in your service desk can be derived from these eight simple metrics! With these KPIs, one can measure and manage a service desk very effectively.
How did we arrive at these eight metrics? Is it a hunch? Suspicion? An academic exercise? No, it’s none of the above. We know that these are the eight metrics that matter most because the empirical evidence from thousands of service and support benchmarks supports this conclusion. But let me explain why these metrics are so critically important.
Cost per Ticket
Cost per unit is a common metric throughout our economy. Many of you know the cost of a gallon of gas, or the cost for a cup of coffee, or the cost of a movie ticket. Yet surprisingly, many IT Support managers do not know their own cost per contact or cost per ticket.
In any service delivery organization, cost, or more accurately unit cost, is critically important. Cost per ticket is a measure of how efficiently IT Support conducts its business. A higher-than-average cost per ticket is not necessarily a bad thing, particularly if accompanied by higher-than-average customer satisfaction and service levels. Conversely, a low cost per ticket is not necessarily good, particularly if the low cost is achieved by sacrificing service levels or customer satisfaction.
Learn more in this Metric of the Month – Best of HDI 2021 #2
Customer Satisfaction
Customer satisfaction and cost per ticket are the yin and yang of IT Support. These metrics are in constant tension, and every IT Support organization grapples with how to strike an appropriate balance between the two. With no restraints on spending, it is relatively easy for a support organization to “spend its way” to high customer satisfaction. Conversely, if customer satisfaction is not an issue, a support organization can reduce its costs almost indefinitely.
Every support organization should be tracking customer satisfaction on an ongoing basis because it is a measure of how effectively a support organization conducts its business. Moreover, every support manager should be regularly asking: If customer satisfaction is one of the “foundation metrics”, how can we affect it? How can we improve it? Put another way, if customer satisfaction is suffering, what is the diagnosis?
Learn more in this Metric of the Month
First Contact Resolution
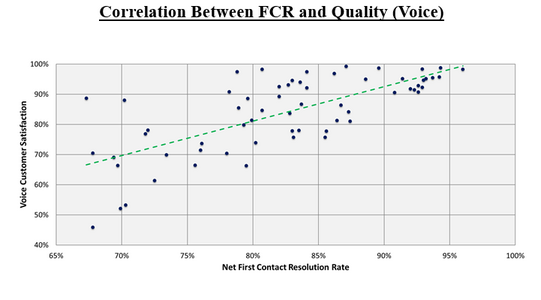
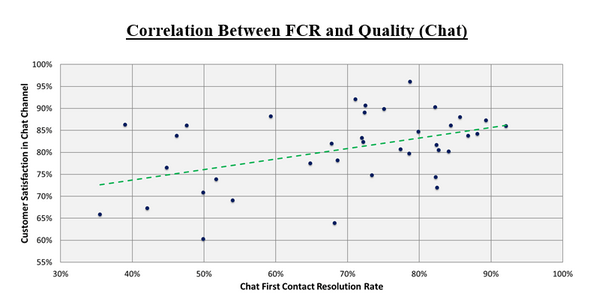
First-contact resolution (FCR), as the name suggests, measures the percentage of tickets resolved on first contact with the customer. A high FCR is almost always associated with high levels of customer satisfaction.
FCR is a measure of how effectively your service delivery organization conducts its business and is a function of many factors, including the complexity and types of transactions handled, the experience of your analysts, the quality of analyst training, and tools such as knowledge management and remote control. The metric is most often measured monthly because a monthly timeframe is long enough to provide statistical significance. But it can also be measured annually, weekly, daily, or even hourly.
Nine times out of ten, when customer satisfaction is lagging, you can achieve significant improvements by increasing first-contact resolution. This is why world-class support organizations pay so much attention to this metric. They engage in a variety of tactics to continuously improve first-contact resolution, including analyst training, investments in knowledge management, and remote-control tools. The strong correlation between FCR and customer satisfaction is illustrated in the two charts below.
Learn more about FCR in this Metric of the Month
Analyst Utilization
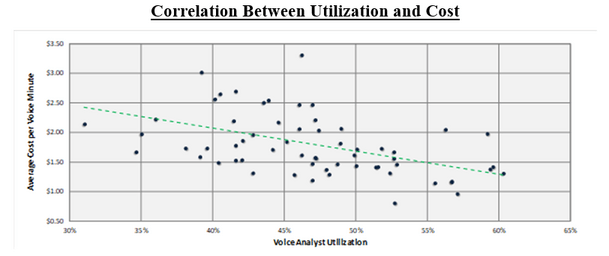
Just as world-class service delivery organizations are obsessive about maintaining high customer satisfaction levels, they are equally committed to keeping their costs in check. They do this primarily by managing analyst utilization. This has the effect of minimizing cost per contact and cost per ticket. That said, extremely high analyst utilization can actually increase your costs by driving analyst turnover and absenteeism higher. Whenever analyst utilization rates approach 60–70 percent, a service desk will experience relatively high analyst turnover because they are pushing the analysts too hard. Extremely high utilization leads to burnout, higher turnover, higher absenteeism, and lower morale in the service desk. The correlation between analyst utilization and cost is illustrated below.
Learn how to capture and calculate utilization in this Metric of the Month
First Level Resolution
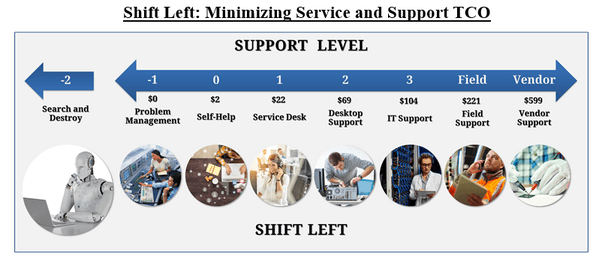
First Level Resolution Rate is a measure of an IT Support organization’s overall competency and is a proxy for Total Cost of Ownership (TCO). A high First Level Resolution Rate helps to minimize TCO because each contact that is resolved at Level 1 avoids a higher cost of resolution at Level n (IT, Desktop Support, vendor support, etc.) as illustrated below. This is why FLR is sometimes referred to as the shift left metric.
Service Desks can improve their First Level Resolution Rates through training, and technologies such as remote diagnostic tools and knowledge-management processes.
Learn more about FLR in this metric of the month
Analyst Job Satisfaction
Analyst Job Satisfaction is a bellwether metric that impacts many other metrics in service and support. It is positively correlated with customer satisfaction and negatively associated with absenteeism and turnover, meaning that absenteeism and turnover go down as analyst job satisfaction goes up. It turns out that the adage “happy agent equals happy customer” is not just a cliché; it can be demonstrated empirically!
As a 30-year veteran of this industry, I have seen support organizations struggle more often than not with poor morale and low job satisfaction. The good news is that both of these factors are controllable. By managing job satisfaction, you are simultaneously driving higher levels of analyst engagement. Some of the primary levers you have for driving job satisfaction, and hence analyst engagement, include training, coaching, and career pathing.
Additionally, psychometric testing and analyst scorecards are two underutilized tools that can have a significant positive impact on analyst engagement in the workplace. Finally, compensation levels that are well above the market minimum not only produce higher levels of job satisfaction, but they also create economic benefits for IT Support, including higher FCR and FLR, that far outweigh the cost of higher salaries.
Learn more about Job Satisfaction in this metric of the month
Mean Time to Resolve (MTTR)
It’s human nature to be impatient when in need of technical support or customer service. It doesn’t matter if customers are calling their bank, their cable company, or their company’s internal technical support department. They want a resolution to their problem or an answer to their question right then and there! Unfortunately, they are often met with barriers to quick resolution such as long mean time to resolve due to understaffing or escalation process inefficiencies.
Many service level agreements include targets for MTTR. Although a low MTTR is a worthy objective, many IT Support organizations go too far in trying to enforce aggressive service levels. Those who pursue this strategy typically believe that aggressive service levels are a prerequisite for achieving high customer satisfaction levels. The truth is that while there is a correlation between MTTR and customer satisfaction, aggressive service levels will not necessarily lead to higher levels of customer satisfaction.
Learn more about MTTR in this metric of the month
The Balanced Score
MetricNet’s research shows that establishing a single, overall performance metric for your support organization is critical. We call this metric the balanced score because it truly does communicate a balanced picture of performance.
The balanced scorecard is a mechanism that aggregates the most important metrics—all those we have covered in this Metric of the Month—into a single, all-inclusive measure of performance. The value of this metric, when tracked over time, is that it lets you determine whether overall performance is improving or getting worse. Moreover, it provides a useful benchmark for comparing your performance against other support organizations.
Learn how to construct a balanced scorecard in this metric of the month
Benchmarking Ranges and Averages
When it comes to the metrics of IT service and support, less really is more! By tracking just eight KPIs and using these KPIs diagnostically to affect continuous improvement in IT support, the job of guiding your support organization towards world-class performance can be greatly simplified.
Please join us for the next Metric of the Month: The Metrics of Knowledge Management, a crucial metric to master for those who are serious about maturing their knowledge management discipline.