
Demonstrate a true picture of IT service and support when you select measures that resonate with the business
Today’s service management tools have increased the number of metrics available and make it easy to publish dashboards showing the current state of IT service and support. But the tendency is to overdo things a bit, putting far too many measures on a dashboard because they are available, rather than because they are needed. I hope to help readers get started in selecting the metrics that make sense to include in dashboards available to end users through a self-service portal and for IT teams and executives.
The Problem with Metrics
IT organizations traditionally spend hours creating reports each month, only to find that these reports are considered meaningless by their business audience. Now that many ITSM platforms have replaced the need to focus on running reports by making dashboards and scheduled reports available, the issue can get worse because it’s so easy to generate information and disseminate it. When asked about reporting, a common theme is that the people responsible for reporting don’t really know what the business needs, so they select a cross section of measures across every area of the platform. This results in IT organizations flooding their audience(s) with a high volume of meaningless metrics. Metrics are often not tied to key objectives, so the audience doesn’t have the ability to determine how well IT is doing against expectations and overall organizational needs.
Make Metrics Meaningful
This problem can be addressed by adopting a business-focused approach to reporting and engaging with members of the business both inside and outside of IT. I cover three design aspects that can be used to direct those discussions and to digest the results of them into a solid metrics program that can be achieved using dashboards.
Why dashboards rather than reports? The problem with reports is that they require further analysis to determine the message and information they are relaying, causing busy people to lose interest. Dashboards provide an at-a-glance ability to determine results quickly and tell the story more effectively than detailed reports.
Typically, this at-a-glance format will resonate well with senior executives across the business, including those within IT. When dashboards are provided within ITSM platforms, they also offer the ability to drill down to the detail level. Thus, when operational managers and staff view dashboards and want to know more about the details that produced them, they can simply drill down into the report view and potentially edit it to add fields for analysis.
As mentioned previously, there are three key aspects to designing the right dashboards, which I describe below:
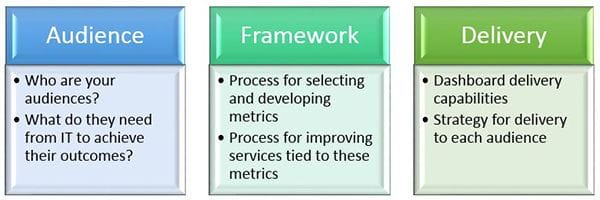
Keep the audience front and center in design. Many of the ITSM platforms in use today can create custom dashboards for different audiences, so the first step to leveraging this ability effectively is to define your audiences. Typically, a metrics practice will attempt to reach the following audiences:
- Senior business executives
- Business partners by line of business or location type
- Senior IT executives
- IT managers (for team productivity)
- Service desk managers (for daily operations)
While there is often a temptation to create one dashboard to satisfy these audiences, the outcome of that could be creating a dashboard that’s not for any of them! Each of these groups has different needs and needs to achieve different outcomes. Defining these audiences and their intended outcomes is an input to the next step of having and using a metrics development framework that enables the development of targeted dashboards.
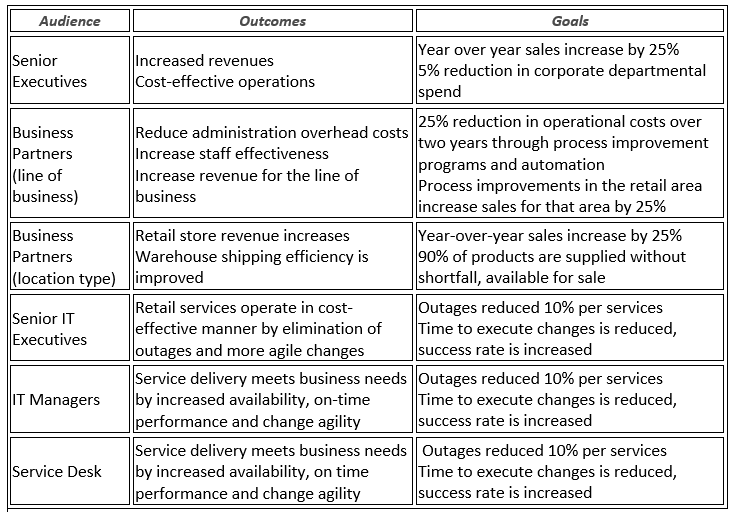
Creating a matrix can help manage this activity. While some examples are provided for IT, the business outcomes and goals are dependent on organization type and will vary widely, so the examples provided are for a retail organization. Additionally, while the outcome may be somewhat general, the goals should be stated in a measurable way. They need to be SMART (Specific, Measurable, Achievable, Relevant and Timely). The reasons for this will become more important when applying them to the framework used to develop the dashboards, as you will need the ability to convert the goals into a key performance indicator that can be placed on a dashboard. Initially, however, it’s most important to gain a thorough understanding of the audience and their needs. The matrix below is somewhat limited in summarizing that understanding, but it’s recommended that the person putting this practice together meets with a focus group representing each audience to understand their business drivers and reporting needs.
Use a metrics development framework to identify measures. Once the audiences and their goals have been identified and documented, a repeatable process is needed to digest the audience needs into measures that can be added to the dashboard. The framework shown below combines continual improvement program concepts with metrics program concepts to provide a simple to follow framework that can be used:

- This framework starts with understanding the organization’s strategic vision and the goals and objectives for which each audience is accountable
- Next, Critical Success Factors (CSFs) are identified, using language that can be measured
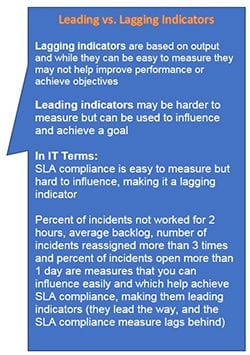
- Working from the CSFs, metrics that indicate whether or not the CSF is being met are selected next. These are your Key Performance Indicators (KPIs) and may be categorized as leading indicators or lagging indicators.
- Next, the actual dashboards are created from the KPIs selected
- Working with each specific audience, the data should be analyzed and reviewed frequently, with any/all gaps documented
- Finally, measures are adjusted, and the program goes into operation
At this point, frequent meetings to review achievements/results should be held to review the outcomes IT has achieved and how these have helped the business achieve their goals and objectives. This may result in starting improvement programs where IT is failing to achieve the desired results or in the business satisfaction with IT increasing and may also lead to changes in the dashboards being provided. The key is that this is an ongoing, interactive process. Without frequent discussion, the measures will become stale as certain achievements become stable and when business needs change.
Plan your delivery. There are several different options for delivering your dashboards. The first step is to consider your audience: are they computer-centric or do they prefer paper? Many of today’s tools can deliver a set of dashboards to a particular audience via a service portal, which is always a valuable option to leverage. In fact, the benefit of this technology is that dashboards can be viewed live and on demand, providing up to date information rather than information that has gone stale. It also enables the audience to act on measures that are trending in the wrong direction, rather than waiting until the end of the month and reacting. It makes it easier to identify areas where service levels could be breached and intervene immediately.
Additionally scheduled reports that combine the measures on the dashboard can take the human factor out of having to remember to run and distribute them and may be preferred by some. Since the reports go stale quickly, discussions should be held with the audience to determine the frequency for distribution.
Finally, the delivery type and schedule should be reviewed during service reviews to ensure that they, as well as the metrics they are delivering, are still relevant and meeting the needs of the business.
Benefits of a Well-Designed Dashboard Program
There are several benefits to establishing audience focused dashboards in the way described here. First and foremost, working with each business audience to select and design measures that tell them whether IT is supporting them sufficiently creates a system of regular interaction, and lack of interaction is why IT organizations generally become disconnected from the rest of the organization. This program of regular engagement will lead to very productive discussions beyond the dashboard results. They offer IT the opportunity to ask the business what else is needed, how their services are performing, whether enhancements are needed. They become a mechanism through which relationships are founded, that enable IT to work successfully with the rest of the business. It also helps IT prioritize requests from the business unit.
Additionally, knowing how IT is being measured enables IT associates to ensure their actions are being taken in effective areas and what the business values. This increases internal engagement and has been said to lead to higher job satisfaction and higher retention.
Finally, since dashboards are directly connected to the ITSM platform, everyone is working from live data and if a measure starts to move in the wrong direction, immediate action can be taken to correct the situation, lessening the business impact. This immediate response capability ultimately contributes to longer-term success.