
Each month, I highlight one Key Performance Indicator (KPI) for service and support. I define the KPI, provide recent benchmarking data for the metric and discuss key correlations and cause-and-effect relationships for the metric. The purpose of the column is to familiarize you with the KPIs that really matter to your organization and to provide you with actionable insight on how to leverage these KPIs to improve your performance! This month, I tackle agent job satisfaction.
Customer satisfaction is top-of-mind for virtually every service organization. and for good reason: it is the single most important measure of quality for a service desk or desktop support group. But what about agent job satisfaction? How important is that, and why don’t more service desks track this metric? It turns out that it’s plenty important, and every support organization should track and trend this metric on an ongoing basis.
Agent job satisfaction is the percentage of agents on the service desk that are either satisfied or very satisfied with their job. It is typically measured annually or semi-annually using an agent satisfaction survey. Unfortunately, fewer than 30% of all service desks track agent job satisfaction. When I ask clients why they don’t track this metric, the answer is usually the same: it’s too difficult to measure, or the metric just doesn’t matter. On both counts, they are wrong. Here’s why
Why It’s Important
Agent job satisfaction is a bellwether metric that impacts many other metrics in the service desk. It is positively correlated with customer satisfaction and negatively correlated with agent absenteeism and turnover, meaning that absenteeism and turnover go down as agent job satisfaction goes up. The figures below show these correlations using data from MetricNet’s 2017 service desk benchmarking database.
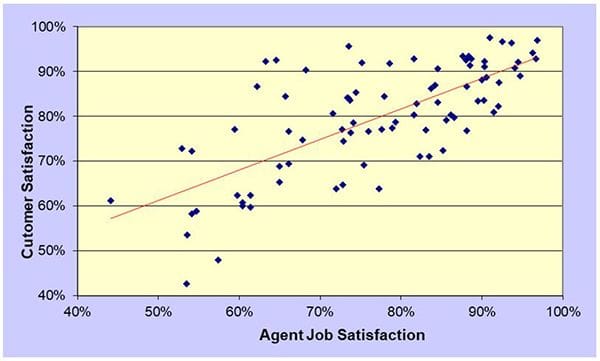
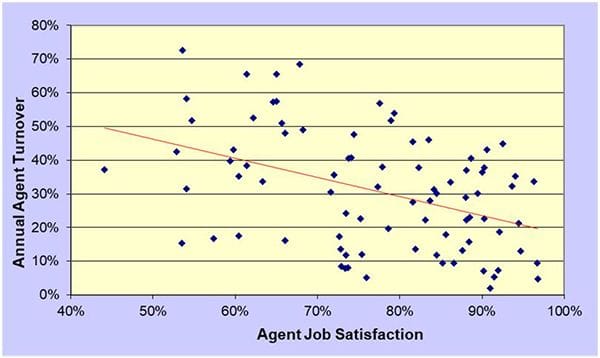
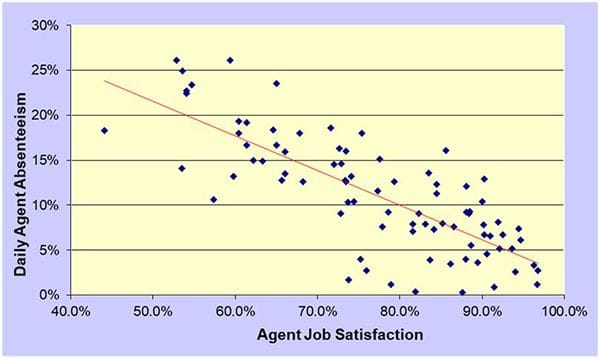
We care about these correlations for two reasons. First, they are not just spurious correlations; they are cause-and-effect relationships. Agent job satisfaction (along with FCR) drives customer satisfaction; it drives agent turnover; and it drives agent absenteeism. More importantly, if we can control agent job satisfaction (which we can), then we can drive positive improvements in customer satisfaction, turnover, and absenteeism.
The second reason is that high agent job satisfaction has positive economic benefits. Inasmuch as improvements in agent job satisfaction can reduce agent turnover and absenteeism, it can also reduce the costs associated with turnover and absenteeism. Last year in North America, the direct cost of replacing an agent, including the cost of screening, recruiting, interviewing, and training an agent was more than $12,000. And this does not even take into account the value of the knowledge and expertise that is lost when an agent leaves the service desk. Turnover is indeed costly!
Key Drivers of Agent Job Satisfaction
I mentioned above that agent job satisfaction can be controlled. But how? Many service desks struggle with low morale among their agents and appear unable, despite their best efforts, to maintain a high level of agent morale on their service desks. Can we do something proactive to manage and improve agent job satisfaction? The answer is yes, and the solution is surprisingly simple.
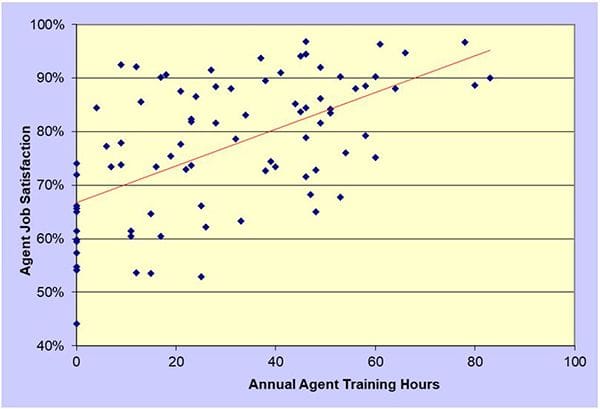
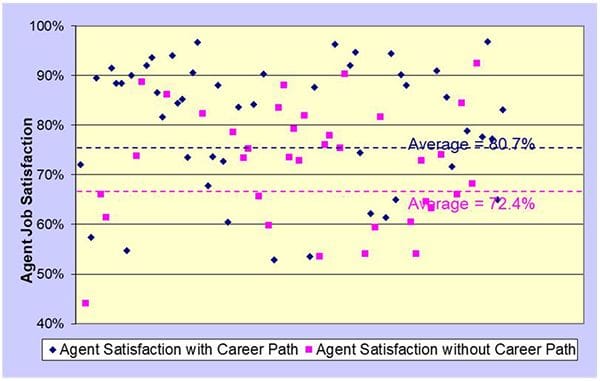
It turns out that agent job satisfaction is driven by training hours, coaching hours, and the existence of a formal career path. Once again, we can turn to our benchmarking data to make this point. The figures below show how training and career pathing impact agent job satisfaction.
Benchmarking Ranges for Agent Job Satisfaction
MetricNet’s benchmarking database shows that the average agent job satisfaction for service desks worldwide is about 77%. That is, 77% of service desk agents are either satisfied or very satisfied with their jobs. This number varies from a low of 44%, to a high of 97%.
As mentioned above, agent job satisfaction is usually measured through annual or semi-annual satisfaction surveys. These surveys typically contain five or fewer questions and can be automated using simple online tools such as Survey Monkey. MetricNet recommends a five-point scale, where a score of 5 represents Very Satisfied, and a score of 1 represents Very Dissatisfied. Given the impact of training, coaching, and career pathing on agent satisfaction, the survey should include a question about each of these. For example, “How would you rank the quality of training you receive on the service desk?” The final, and most important question of the survey, should always be some variation of “How would you rate your overall job satisfaction on the service desk?”
Please join me for next month’s Metric of the Month: Desktop Cost per Ticket, the most important measure of efficiency in desktop support.