
Each month, I highlight one Key Performance Indicator (KPI) for service and support. I define the KPI, provide recent benchmarking data for the metric, and discuss key correlations and cause-and-effect relationships for the metric. The purpose of the column is to familiarize you with the KPIs that really matter to your organization and to provide you with actionable insight on how to leverage these KPIs to improve your performance! This month, I tackle customer satisfaction.
Customer satisfaction is by far the most common measure of quality. It is widely used, not just in IT service and support, but in all industries. It is so ubiquitous that most of us have probably been surveyed within the last week, by our bank, an airline, our insurance company, a hotel, or some other service provider. The metric is so common, that most have an intuitive feel for customer satisfaction. We know, for example, that a customer satisfaction rating of 70% is probably not very good, while a customer satisfaction score of greater than 90% is very good indeed!
Customer satisfaction is the percentage of customers who are either satisfied or very satisfied with the quality of support they receive. It is equally applicable to the service desk and desktop support and is the single most important measure of quality for a support organization. In this article, I will use service desk examples and benchmarking data, but the principles discussed apply equally to desktop support.
Why It’s Important
As we learned in April’s Metric of the Month, cost per ticket and customer satisfaction, are the foundation metrics in service and support. They are the two most important metrics because ultimately everything boils down to cost efficiency (as measured by cost per ticket) and quality of service (as measured by customer satisfaction).
In any service delivery organization, quality of service, as measured by customer satisfaction, is critically important. Customer satisfaction is a measure of how effectively a support organization conducts its business. Every service and support organization should be tracking customer satisfaction on an ongoing basis.
How It’s Measured
There are almost as many different ways to measure customer satisfaction as there are service organizations that track the metric. I have seen surveys that contain as few as one question and surveys that contain as many as 40 questions. I have seen multiple choice, fill-in-the-blank, and interview-style surveys. I have seen scoring systems that offer as few as 2 choices per question, and as many as 12 choices per question. The result is that customer satisfaction has the greatest variability of any metric in service and support.
When you think about the number of different survey questions, survey types, scoring scales, and survey populations, it is easy to understand why survey bias and invalid survey methodologies are so common in the industry. HDI’s Customer Satisfaction Index has addressed this industry shortcoming, and presents a valid, standardized approach to measuring customer satisfaction for all support organizations.
Key Drivers of Customer Satisfaction
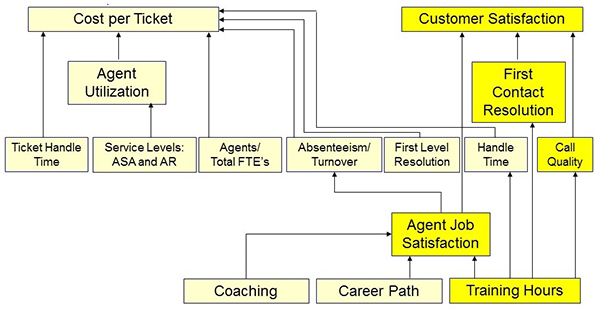
Borrowing the cause-and-effect diagram from April’s Metric of the Month, we can see that customer satisfaction has a number of key drivers. The most important of these drivers are first contact resolution rate (FCR) and agent job satisfaction. Secondary drivers are call quality and agent training hours. These KPIs are highlighted in the diagram below.
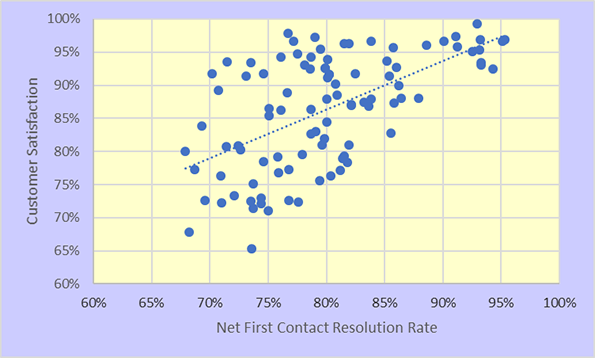
The relationship between FCR and customer satisfaction (illustrated in the chart below) is well known and has been observed empirically for quite some time. Strictly speaking, FCR applies only to live channels, which include voice, chat, and walk-up. For the non-live channels, which include email and web submitted tickets, there is no standard on how FCR is defined. But the general rule of thumb in the industry is that resolution within one hour counts as FCR.
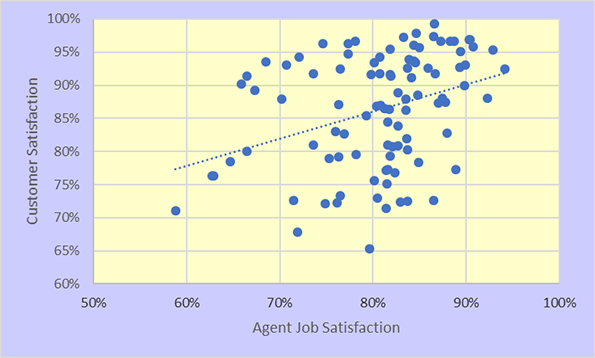
What is less well known, and often surprising to many people, is the strong cause-and-effect relationship between agent job satisfaction and customer satisfaction, illustrated in the chart below. It turns out that the adage “happy agent equals happy customer” is not just a cliché; it’s really true!
Cost vs. Quality
Any discussion of customer satisfaction must take place in the context of cost. Customer satisfaction and cost per ticket are the yin and yang of a service organization. These metrics are in constant tension, and every service organization grapples with how to strike an appropriate balance between the two. With no restraints on spending, it is relatively easy for a service desk to “spend its way” to high customer satisfaction. Conversely, if customer satisfaction is not an issue, a service desk can reduce its costs almost indefinitely.
Every support organization does, of course, operate with both spending limitations and quality standards. The objective, therefore, is to achieve the highest possible quality within the budgetary constraints placed on an organization. Some service desks that operate under severe budgetary restrictions are doing quite well when they achieve a 75% customer satisfaction score. By contrast, a service desk with a relatively generous budget that achieves an 85% customer satisfaction score may not be doing so well, despite having a higher absolute customer satisfaction score. The point is that cost matters, and customer satisfaction must be interpreted in light of the spending constraints that a service organization operates under.
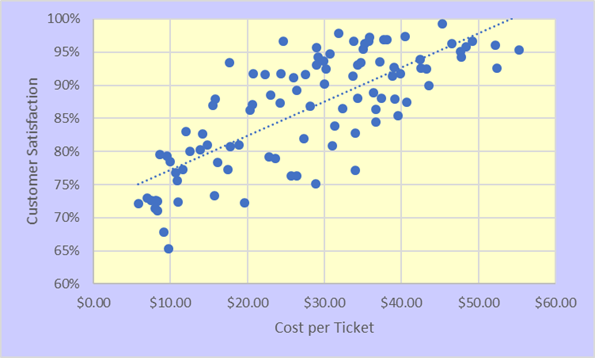
The figure below shows the relationship between customer satisfaction and cost per ticket for a representative cross-section of North American service desks. The tradeoff between cost and quality is apparent, but at any given spending level the more effective support organizations achieve higher levels of customer satisfaction.
As you know from the last two monthly metrics columns, cost per ticket and customer satisfaction are the foundation metrics in service and support because everything boils down to these two metrics. This insight is both enlightening and liberating. Viewed through the twin lenses of “will it contain cost” and “will it improve customer satisfaction,” management decisions are often greatly simplified by answering these two questions.
Benchmarking Ranges for Customer Satisfaction
The North American averages and ranges for customer satisfaction in 2016 are shown in the figure below, along with the comparable statistics for the underlying drivers of customer satisfaction, FCR and agent job satisfaction.
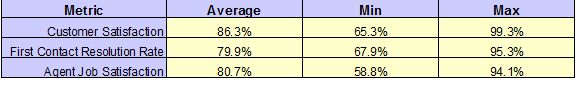
The ranges for customer satisfaction (min to max) are quite large. The reasons for this have been explained above and include variations in FCR, agent job satisfaction, and cost per ticket.
Please join me for next month’s Metric of the Month: Agent Utilization, the primary driver of cost per ticket in service and support.