
For a service desk, FCR is the percentage of contacts that are resolved by the service desk on the first interaction with the customer. For live calls or web chats, this means that the customer’s issue is resolved before they hang up the phone or end the chat session. Calls or chats that require a customer callback or are escalated to another source of support do not qualify for first contact resolution. For emails and web submitted tickets, which now account for a significant percentage of all service desk contacts, the de facto standard emerging in the industry is that resolution within one business hour of receiving a customer email or web ticket counts as FCR.
FCR is typically measured in one of two ways:
- The service desk agent checks a box on the trouble ticket at the conclusion of the call or chat session to indicate if the call was successfully concluded on the initial contact.
- Customers are asked in follow-up customer satisfaction surveys whether their call or chat was resolved and concluded on the initial contact with the service desk.
The first method requires periodic audits to ensure that agents are accurately reporting FCR on the tickets they handle. This is done by reviewing a representative sample of tickets each month to determine if the tickets designated FCR by an agent are, in fact, being resolved on the first contact with the customer. Neither method of measuring FCR is perfect, but it is one of the most important KPIs to track and trend
Why It’s Important
A high FCR is almost always associated with high levels of customer satisfaction. FCR is a measure of how effectively your service desk conducts its business and is a function of many factors, including the complexity and types of transactions handled, the experience of your agents, the quality of agent training, and tools such as knowledge management and remote control. The metric is most often measured monthly, because a monthly timeframe is long enough to provide statistical significance. But it can also be measured annually, weekly, daily, or even hourly.
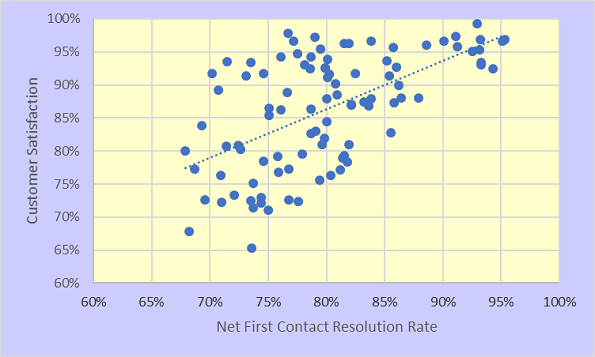
The figure below shows the relationship between FCR and customer satisfaction for a representative cross-section of service desks worldwide. This strong cause-and-effect relationship should come as no surprise. As stated above, we all want closure on the first contact with our service providers!
Net vs. Gross FCR
Certain types of contacts cannot be resolved remotely by the service desk. These include hardware break/fix and physical move/add/change requests. So, do these contacts count against a service desk when calculating FCR? Well, yes and no. Let me explain.
Gross FCR looks at all incoming contacts and makes no adjustment for contacts that cannot be resolved by the level 1 service desk. The formula for Gross FCR is:
Gross FCR = (Number of tickets resolved on first contact ÷ All incoming tickets)
By contrast, Net FCR adjusts for contacts that cannot be resolved remotely at the service desk. Specifically, the calculation for Net FCR carves out those contacts that cannot be resolved at level 1. The formula for Net FCR is:
Net FCR = (Number of contacts resolved on first contact ÷ (All incoming contacts contacts that cannot be resolved at level 1))
In other words, the denominator of the Net FCR ratio is adjusted to include only contacts that can potentially be resolved at level 1. These adjustments are sometimes called carve outs.
Net FCR is by far the more relevant of the two FCR metrics. In fact, most organizations do not even track Gross FCR because it produces a distorted picture of service desk performance and is often misinterpreted.
Key Drivers of FCR
As shown above, FCR is a key driverin fact, the most important driverof customer satisfaction. But what drives FCR? If a service desk wants to improve FCR, how would they go about doing it? If we go back to our cause-and-effect diagram for service desk KPIs, we can see that agent training hours are the biggest driver of FCR.

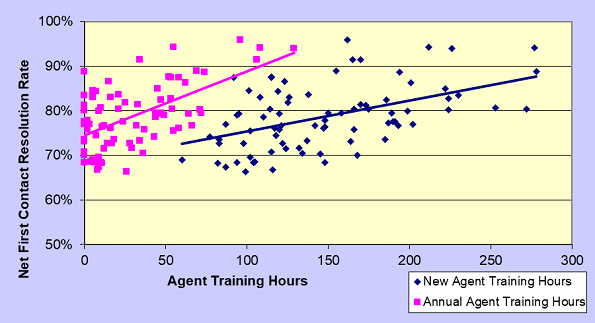
The figure below show the relationship between New Agent Training Hours, Annual Agent Training Hours, and Net FCR. The clear implication is that agent training pays off in terms of improved FCR, and that, in turn, yields improvements in customer satisfaction.
Technology Drivers of FCR
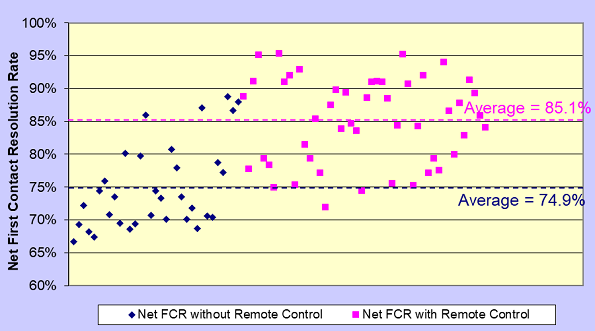
In addition to training hours, two technologies in particular can significantly increase FCR. One is remote control technology that enables a support technician to proxy into a user’s device. The second is knowledge-centered services, or more accurately, the maturity of KCS. Benchmarking data shows that support desks with remote control technology average FCR rates that are approximately 10 percentage points higher than those who do not employ this technology (as the figure below illustrates). Likewise, support desks with mature KCS have FCR rates that are approximately 12 percentage points higher than those with no or immature KCS.
Benchmarking Ranges for Net FCR
The global averages and ranges for Net FCR for the first half of 2017 are shown below, along with the comparable statistics for the key drivers of FCR, agent training hours.
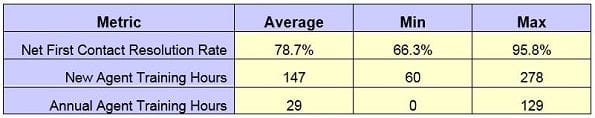
The ranges for FCR (min to max) are quite large. The reasons for this have been explained above and include variations in training hours and the use of technology tools such as remote control and knowledge centered support.
Please join us for next month’s Metric of the Month: Agent Utilization, the primary driver of cost per ticket in service and support.