
And what do you plan to do about it?
“The important thing is not to stop questioning.”Albert Einstein
Service and support organizations face many complexities and challenges. There is always a feeling of “organized chaos” with our service desk and desktop teams, especially on Mondays, whether handling typical daily operations of incidents and requests, supporting implementation projects and migrations, or handling P1 or P2 service disruptions. The challenge is in finding the time to take a deep breath and address what’s really going on and why.
It’s typically just another day, another crisis, another call volume spike caused by a service outage. It was during one of these chaotic moments I realized we needed to make the data analytics deep dive a part of our ongoing operational activities. We needed to utilize the team’s operational experience and bring some analytical thinking to uncover opportunities for contact reduction that would take the form of deflecting to self-serve, uncovering workflow automation opportunities, and eliminating contacts/work effort. We needed to confidently know and use available data, metrics, and reporting to ask relevant questions, identify trends, and seek the answers/solutions to why they are calling and what we can do to deflect or eliminate.
We track weekly and monthly metrics revealing 13-month trending and graphically combine key metrics representing a “visual story” reflecting areas of opportunity. We utilize these metrics/graphs in a business-case approach to prove and justify the implementation of any recommended action based on estimated impact and results. Quality decision making depends on quality data! If you are going to spend the time conducting a data analytics workshop for the purpose of identifying call deflection or elimination opportunities, you’ll want to first have confidence in the data. We established monthly operational management meetings to select the most opportunistic areas that would be the target of a workshop designed to examine the data, reports, and graphs and just ask questions!
A New Opportunity
We had just taken on Level 2 (L2) support to join our new Level 1 (L1) team in providing support services for a business division and their application services for external customers. We looked at the reports, data, and trending months, which led us to ask why the issues and requests were taking so long to resolve when assigned to Level 2 when a First Call Resolution (FCR) was not achieved. We determined we needed to do a better job categorizing the FCR opportunities currently being assigned and inundating the L2 team. We also needed to improve our documentation, triage and troubleshooting decision trees, and knowledge authoring and expand the access to relevant knowledge articles (KA) for the L2 team.
After a brief observation exercise, we noted that as a remote team, they were constantly recreating troubleshooting and diagnostic steps as well as not sharing the identified root cause and eventual resolution with their teammates. We had just completed the KCS training for the L1 team members, and now the action plan was to focus on exposing the L2 team to the Knowledge-Centered Service (KCS) practices. We explained to them the rippling effect of all the important end-to-end service and support activities and tasks and the consequential results when any part of the process flow is delayed. For example, when an issue/request was assigned to L2 from L1 without workload (queue) management and balancing, prioritization, subject matter expertise considerations or required response time, everything is impacted, most importantly the customer experience.
After reviewing all the data and identifying missing metrics around the end-to-end service process flow, we experienced many “Ah-Ha” moments. Tickets were literally growing old on the vine (aging) as they remained in the L2 assignment queues as the team processed all assigned tickets in the order they were received. We uncovered some cherry-picking and some “defer till later based on complexity or customer” behavior. We were confident in the potential impact of delivering a formalized Level 2 training program that would include KCS, support best practices training, and the basics of quality ticket documentation.
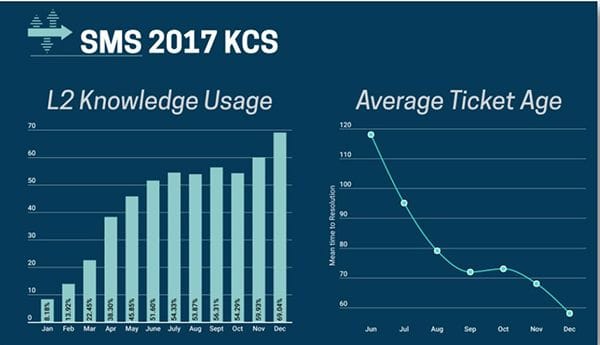
At the end of 2016, we established the training program and began training our L2 team members in January 2017 by bringing them all to campus for one week. As you can see in the graph below, as training continued throughout the months, the number of knowledge articles and usage by the team increased and the average time to resolve (ticket age) continued to decrease. By year end, the Mean Time to Resolve (MTTR) decreased from 2 hours to 1 hour. This had a rippling effect on all of our metrics, but the ones that were most significantly improved were our Service Level Adherence (SLAs), Customer Satisfaction (CSI), and Cost Per Ticket.
Shifting to Self-Service
Our most recent data analytic opportunity is in managing our password management calls for resets and unlocks. The IT Service Desk is experiencing an increase (1015%) in contact volume (calls/chats) due to multiple migrations, rollouts, and upgrades. As average speed of answer (ASA) and abandons have steadily increased, we have determined that we must target the password reset/unlocks call types for deflection.
If they incorrectly enter their password three times, they are automatically locked-out. And our security policy dictates that every employee must change (reset) their password every 90 days. We have a self-service solution that is conveniently located on every computer’s login screen (14,000 seats). We have made significant progress in registering employees to use our self-service solution. They simply answer six security questions, and they are ready to go! The experience is easy and consistent and takes less than a minute to successfully reset or unlock a password.
We continued to be puzzled as to why employees continue to contact us via phone or our chat channel to reset/unlock their passwords with the current average wait time being over five minutes. These password management contacts constitute between 1015% of our daily contact volume. We are making this call type our priority for self-serve deflection while continuing to identify other call types for both self-serve and FCR deflection.
Our Action Plan
We reviewed the most recent reports to see which employees have registered (answered security questions) and choose not to use the self-service option versus those who have yet to register. We will create marketing and communication campaigns as well as create a brief training tutorial for posting on our internal website. If we can deflect 50% or more of the current contact volume (20%) to the self-serve solution, we will see another metric rippling effect of reduced abandons and average speed to answer and a joyous return to consistent, achievable service levels.
We began talking and thinking about what impactful metrics and data-driven graphs we could create and use to continue to gain senior IT and business leadership support for our campaign. We would have to strongly position ourselves with a senior management team who supports our call deflection initiative versus adding more staff. But careful preparation, data driven facts, thoughtful recommendations, and customer-focused messaging will clearly be our keys to success:
- We have the opportunity to deflect a large majority of password reset/unlocks contacts (calls/chats) being handled by the IT Service Desk. Our service desk currently resolves over 1000 password reset/unlock requests tickets monthly.
- These contacts are impactful in many ways (volume, time to handle, time to document), but our main message is that it is impacting our SLAs (Abandons and Average Speed of Answer) and preventing other calls/customers who do not have self-service options from getting serviced and back to work in a timely manner.
- The average speed to answer (wait time) impact has significantly increased due to our handling of additional project-focused contact volume caused by our Microsoft Office 2016 Pro Plus upgrades and Microsoft Exchange migration projects.
- We have 75% of our employees registered to utilize the password reset/unlock tool. We have 75% of those registered employees that regularly utilize the password reset/unlock tool versus contacting the IT Service Desk.
- Our goal is to register the remaining 25% of the employee base to regularly utilize the password reset/unlock tool and significantly reduce the volume of contacts coming into the IT Service Desk for password reset/unlocks.
- Through weekly reports, we will continue to target customers who have successfully registered to use the self-service password reset/unlocks tool but continue to contact the IT Service Desk rather than utilize the tool when their account is locked or they need to reset their password.
- The cost to the company for handling password reset/unlock contacts at $16.25 a contact with 1,000 contacts a month is $16,250 per month.
Moving Forward with Data
The timing of our initiative to better utilize our data to ask relevant questions to challenge us to identify those data-relevant pieces that helped us “connect the dots” was perfect. We are much better prepared to break down our categorization into normal operational issues, requests and how-tos (repetitive/year over year), P1 and P2 related contacts, and project related contacts. We are better prepared to present weekly categorization breakdown charts that help the team identify root cause and provide eventual long-term solutions, eliminating the repetitive contacts related to the issue. Lastly, we are now able to justify any required short-term staff augmentation to assist in maintaining our service level commitment to our customers during project migrations, rollouts, and implementations.
If your service strategy requires ongoing continuous improvement, then you will also need to create an ongoing discipline for asking questions. In order to achieve this level of service maturity, you must first get the quality of your data house foundationally solid so you can build your data analysis, reporting, and actionable recommendations with confidence. Good luck on your data analytic journey. May you uncover opportunities for action, results, and a great fireside story!